


Radwave
คำอธิบายของRadwave
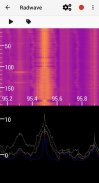
Radwave makes it possible to interactively explore full resolution RF spectrum. You can look through massive datasets served from the cloud using just your phone or tablet, or use an RTL-SDR dongle and the RTL2832U driver app to collect data locally on your device and interactively explore in real time.
You can dynamically zoom in and out in time and frequency, pause, and go back in time - all without losing any samples. If you find something cool, tag it and share with friends.
Radwave’s cloud based datasets currently include data from Breakthrough Listen, including data from Voyager 1 and ‘Oumuamua. Radwave’s core technology provides low latency1 access to full resolution spectrograms created from the raw GUPPI files. By using intuitive pan/zoom gestures, you can easily explore the full resolution spectrum, manipulating time, frequency and power colorization dynamically. Coming soon are datasets collected from Radwave HQ for FM radio and NOAA weather satellites.
Radwave core technology is its interactive real-time spectrogram/waterfall plot. It shows the entire spectrum - utilizing every sample2 - for the entire collection3. Frequencies are aligned over time as you change the RF center frequency4, helping you make sense of what you see.
Learn more at www.radwave.com.
Please note that Radwave does *NOT* currently support audio demodulation. This functionality is planned for a future release, but is not in the current version.
1 Cloud based datasets are currently hosted in AWS US East 1, so latency may vary geographically
2 Adjacent non-overlapping DFT windows
3 Up to device limitations
4 Alignment limited by buffer uncertainty
We're in beta!
We're launching in beta as a crowd funding method, but without you having to wait to have something usable. We'll be continuing to add features and functionality. Email us at support@radwave.com or contact us on Twitter at @RadwaveRF and let us know what you want to see so that we can prioritize our time.
Radwave ทำให้สามารถสำรวจสเปกตรัมคลื่นความถี่วิทยุที่มีความละเอียดเต็มรูปแบบได้ คุณสามารถดูชุดข้อมูลขนาดใหญ่ที่ให้บริการจากคลาวด์โดยใช้เพียงโทรศัพท์หรือแท็บเล็ตของคุณหรือใช้ด็องเกิล RTL-SDR และ ไดรเวอร์ RTL2832U เพื่อรวบรวมข้อมูลในเครื่องของคุณและสำรวจแบบโต้ตอบตามเวลาจริง
คุณสามารถซูมเข้าและออกในเวลาและความถี่แบบไดนามิกหยุดชั่วคราวและย้อนเวลากลับ - ทั้งหมดโดยไม่สูญเสียตัวอย่างใด ๆ หากคุณพบสิ่งที่เจ๋งติดแท็กและแชร์กับเพื่อน ๆ
ปัจจุบันชุดข้อมูลบนคลาวด์ของ Radwave นั้นรวมข้อมูลจาก การฟังแบบแยกผ่าน รวมถึงข้อมูลจาก Voyager 1 และ ‘Oumuamua เทคโนโลยีหลักของ Radwave ให้การเข้าถึง 1 ที่มีความหน่วงต่ำในการเข้าถึงสเปคตรัมความละเอียดเต็มรูปแบบที่สร้างจากไฟล์ GUPPI แบบดิบ ด้วยการใช้ท่าทางแพน / ซูมที่ใช้งานง่ายคุณสามารถสำรวจสเปกตรัมความละเอียดเต็มรูปแบบได้อย่างง่ายดายจัดการเวลาความถี่และการปรับสีพลังงานแบบไดนามิก เร็ว ๆ นี้เป็นชุดข้อมูลที่รวบรวมจาก Radwave HQ สำหรับวิทยุ FM และดาวเทียมพยากรณ์อากาศ NOAA
เทคโนโลยีหลักของ Radwave คือโครงร่างสเปคตรัม / น้ำตกแบบเรียลไทม์ มันแสดงให้เห็นถึงสเปกตรัมทั้งหมด - ใช้ทุกตัวอย่าง 2 - สำหรับคอลเล็กชันทั้งหมด 3 ความถี่จะถูกจัดเรียงตามช่วงเวลาเมื่อคุณเปลี่ยนความถี่ศูนย์ RF 4 ซึ่งจะช่วยให้คุณเข้าใจถึงสิ่งที่คุณเห็น
เรียนรู้เพิ่มเติมที่ www.radwave.com
โปรดทราบว่า Radwave ทำหน้าที่ * ไม่ * ปัจจุบันสนับสนุนการถอดรหัสเสียง ฟังก์ชันการทำงานนี้มีการวางแผนสำหรับการเปิดตัวในอนาคต แต่ไม่ได้อยู่ในรุ่นปัจจุบัน
1 ชุดข้อมูลบนคลาวด์มีโฮสต์อยู่ใน AWS US East 1 ดังนั้นเวลาในการตอบสนองอาจแตกต่างกันทางภูมิศาสตร์
2 หน้าต่าง DFT ที่ไม่ได้ซ้อนกันอยู่ติดกัน
3 มากถึงขีด จำกัด ของอุปกรณ์
4 การจัดแนวถูก จำกัด ด้วยความไม่แน่นอนของบัฟเฟอร์
เราอยู่ในช่วงเบต้า!
เรากำลังเปิดตัวเป็นเบต้าในรูปแบบการระดมทุนแบบฝูงชน แต่คุณไม่ต้องรอให้มีสิ่งที่ใช้งานได้ เราจะทำการเพิ่มคุณสมบัติและฟังก์ชั่นต่อไป ส่งอีเมลถึงเราที่ support@radwave.com หรือติดต่อเราทาง Twitter ที่ @RadwaveRF และแจ้งให้เราทราบว่าคุณต้องการเห็นอะไรเพื่อให้เราสามารถจัดลำดับความสำคัญเวลาของเรา
Radwave--เวอร์ชั่น0.5.8
(06-06-2020)Radwave - ข้อมูล APK
เวอร์ชั่น APK: 0.5.8แพ็คเกจ: com.radwave.radwave.androidเวอร์ชั่นล่าสุดของRadwave
เวอร์ชั่นอื่น


แอปในประเภทเดียวกัน


